01 Oct Determine Biofouling Through Data
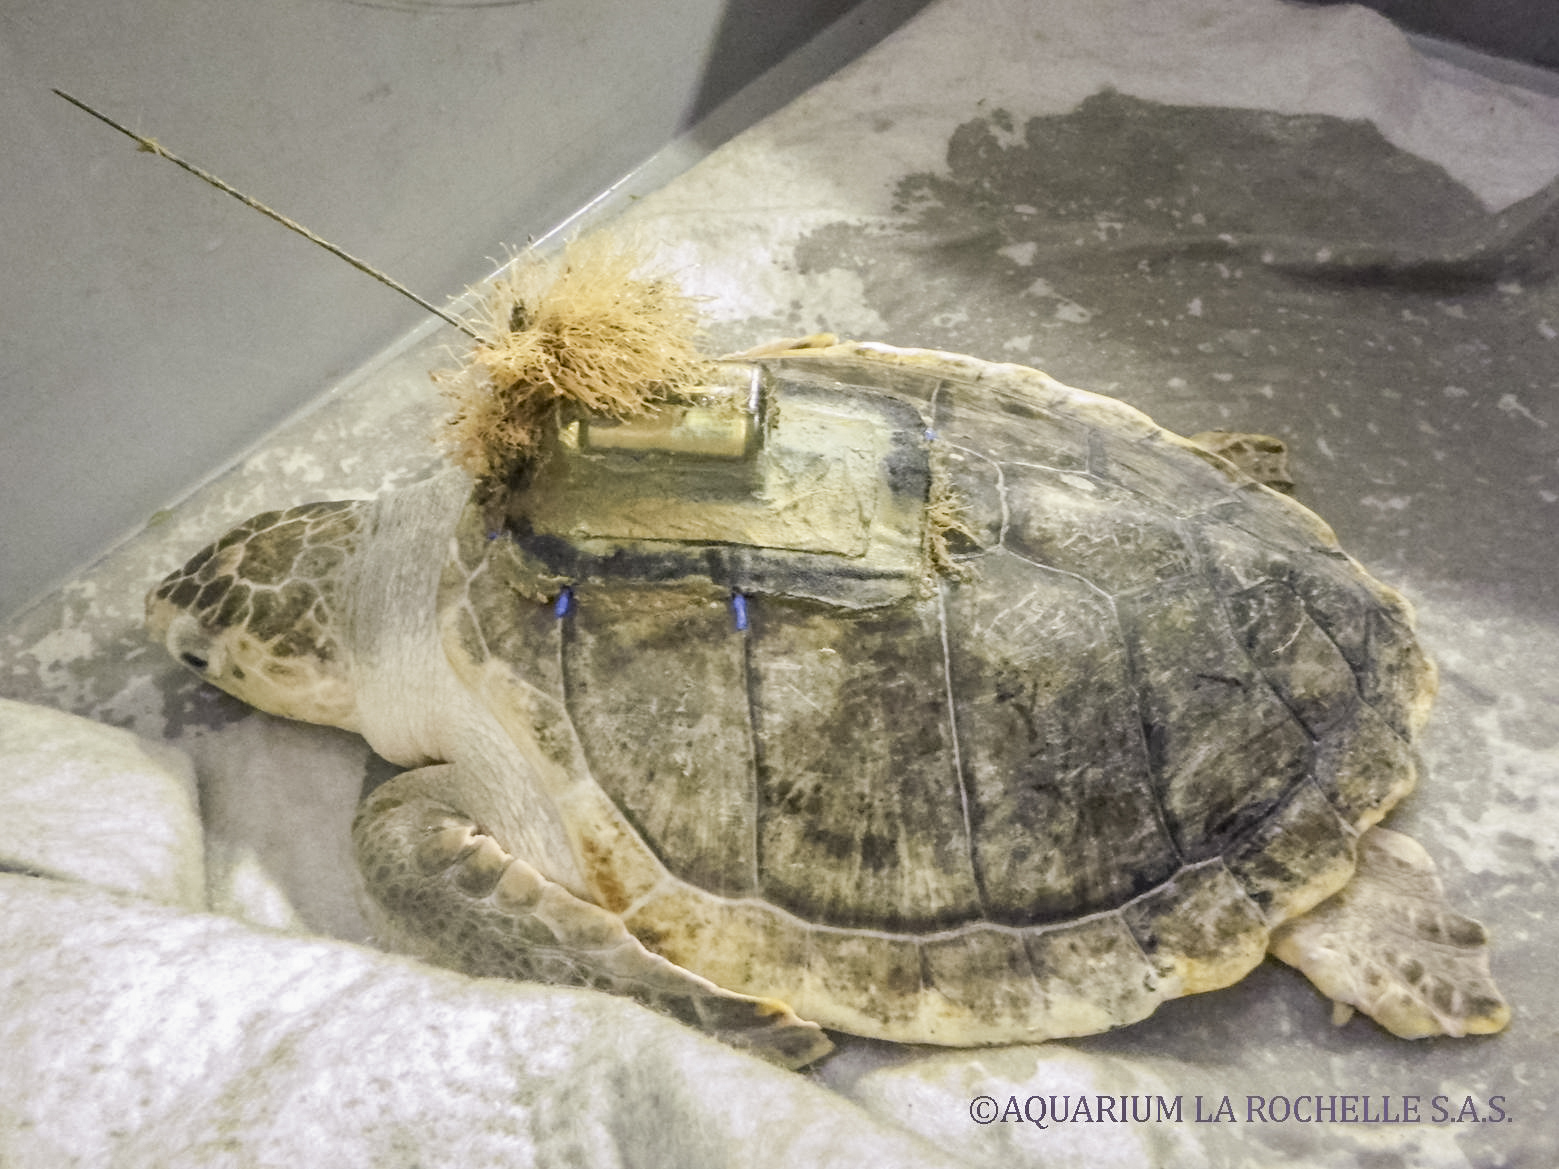
Biofouling is a scourge for scientists and researchers using tags to collect data from marine animals. Not only does biofouling add drag and reduce overall hydrodynamic performance but can also impede, or worse, eliminate the tag’s ability to communicate with Argos satellites.
When a tag breaches, exposing the sensors and antenna to air, water runs off the smooth exterior allowing the wet/dry sensor to take a ‘dry’ reading which initiates satellite transmissions or a Fastloc GPS snapshot. Excess growth around the wet/dry sensors can reduce sensitivity. In the worst-case scenario with biofouling completely covering the tag and sensors, the tag believes it is continuously wet, resulting in no transmissions ever attempted. Alternatively, constantly dry (in the event of barnacle-type biofouling) the tag will continuously attempt to transmit, even when submerged, resulting in a shortened life expectancy of the tag.
Excessive biofouling on the Argos antenna, particularly near the tip, will cause the antenna to droop in the water and prevent transmissions from being received by the Argos satellites (even if the wet/dry sensor reads ‘dry’).
The degree of biofouling is compounded in warmer tropical and subtropical waters on air-breathing animals and those that frequent shallower waters. Conversely, it is minimized in colder waters and with deep-diving animals.
Using Data to Show Biofouling
So how can you tell if your tag is biofouled?
Biofouling on a tag could cause the following conditions to occur:
- Dry—tag thinks it is continually dry and exhausts the battery transmitting even when the tag is underwater.
- Wet—most common; the tag thinks it is continually submerged and never transmits, even when at the surface or hauled out.
There may be a few ways to determine possible biofouling by using My Data from the Wildlife Computers Data Portal.
- Wet/dry sensor data normally runs between 0 and 255. A dry tag reads 255 and a tag submerged in seawater reads approximately 20. When these numbers are close—within about 50 units—the tag will assume it is wet.
- Messages per day/transmit count discrepancy. If very few messages are getting through but the transmit count is jumping up each day, the tag may be constantly reading dry and trying to transmit underwater.
Diagnostic wet/dry data
You can determine the wet/dry condition of the tag if those data were selected for transmission. In your tag data, the -Status.csv file contains columns named MinWetDry and MaxWetDry. These values will allow you to assess fouling. These are the minimum and maximum wet/dry sensor values from the previous day.
Interpreting the Data
Data from a tag without biofouling can be seen in Figure 1. The minimum and maximum values are consistent and maintain a large difference, with MinWetDry at approximately 20 and MaxWetDry at approximately 255. This tag has no signs of fouling.
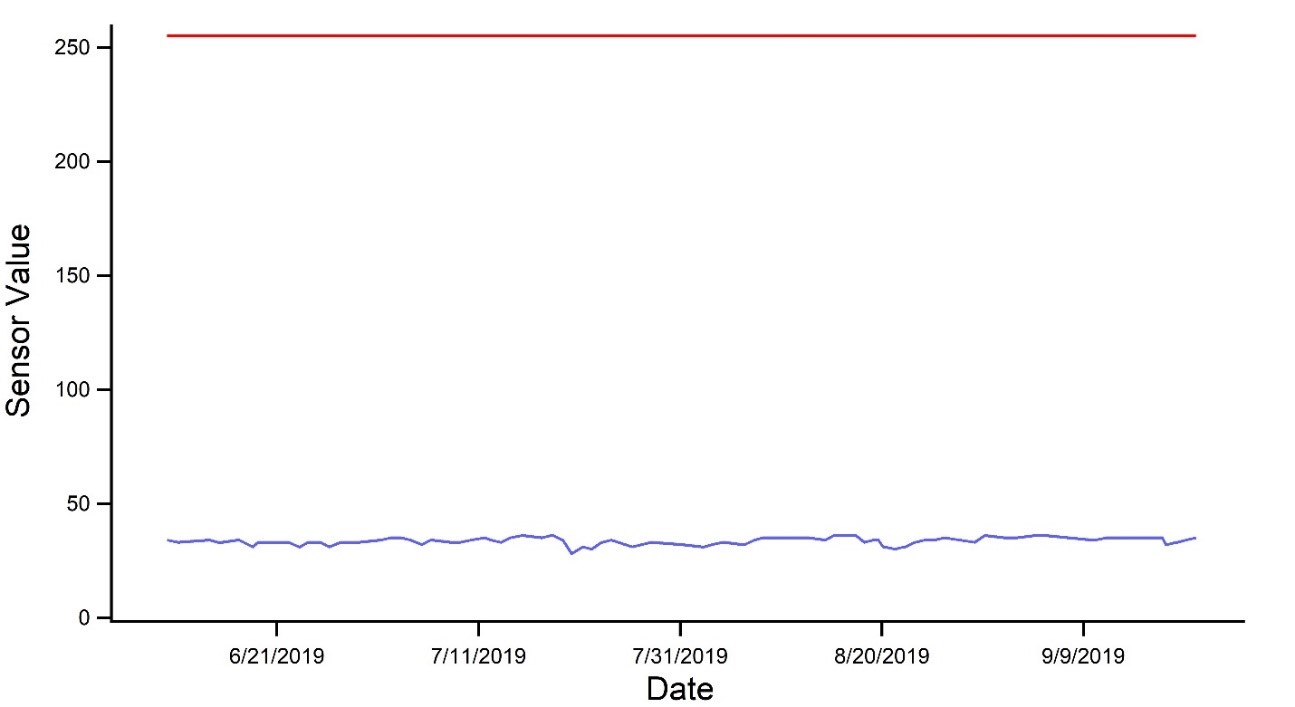
Figure 1. Typical wet/dry values for a tag that is not fouled. Blue indicates the minimum wet-dry value (MinWetDry) for the previous day and red indicates the maximum value (MaxWetDry) for the previous day.
If there was an increase in the blue MinWetDry, this indicates a sensor is covered or the tag is in less conductive water. Figure 2 shows an example of a tag that passed by a river mouth where the influence of freshwater can be seen. The tag is not fouled in this case, and the tag is reporting a change in the ocean conditions. The auto threshold ability of the tag will allow it to operate normally while it passes through this area of low conductivity.
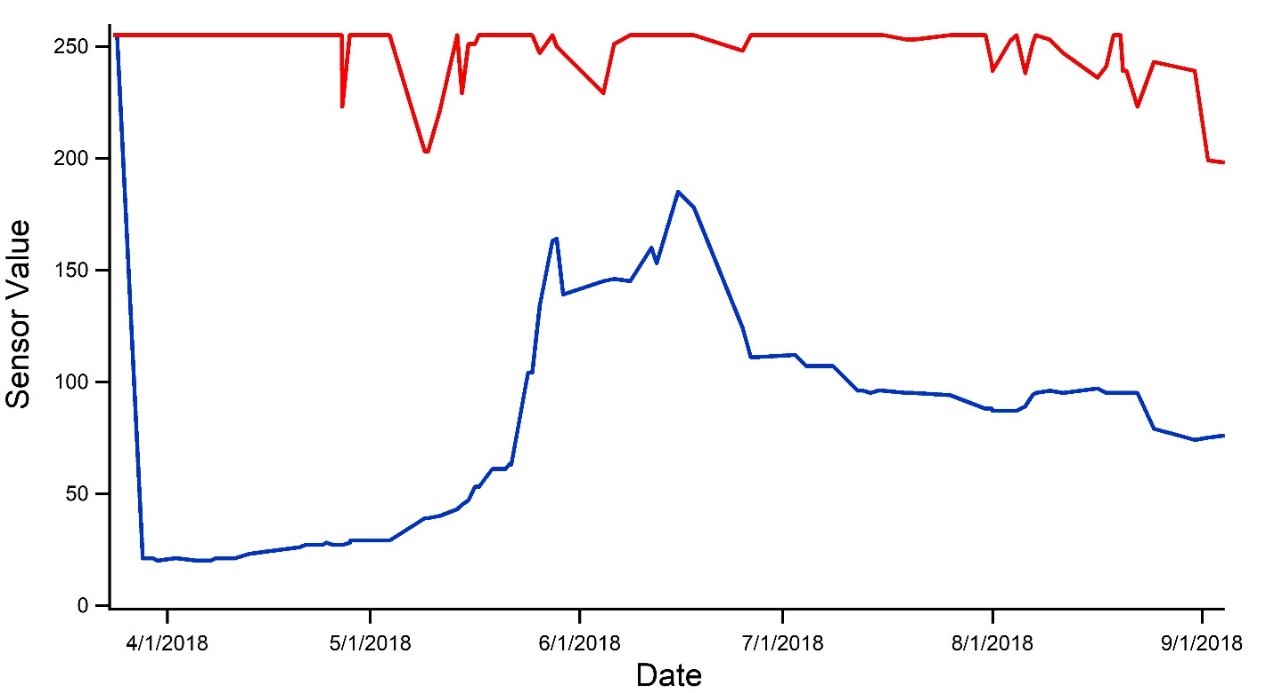
Figure 2. Wet-dry values for tag passing by a river mouth. Blue indicates the minimum wet-dry value (MinWetDry) for the previous day and red indicates the maximum value (MaxWetDry) for the previous day.
In Figure 3, the tag on the left was not protected and failed after 4 months, whereas the tag on the right had 3 coats of anti-fouling paint and was not impacted by biofouling after 7 months. A reduction in the red MaxWetDry value indicates that the tag is not drying out and biofouling is occurring.
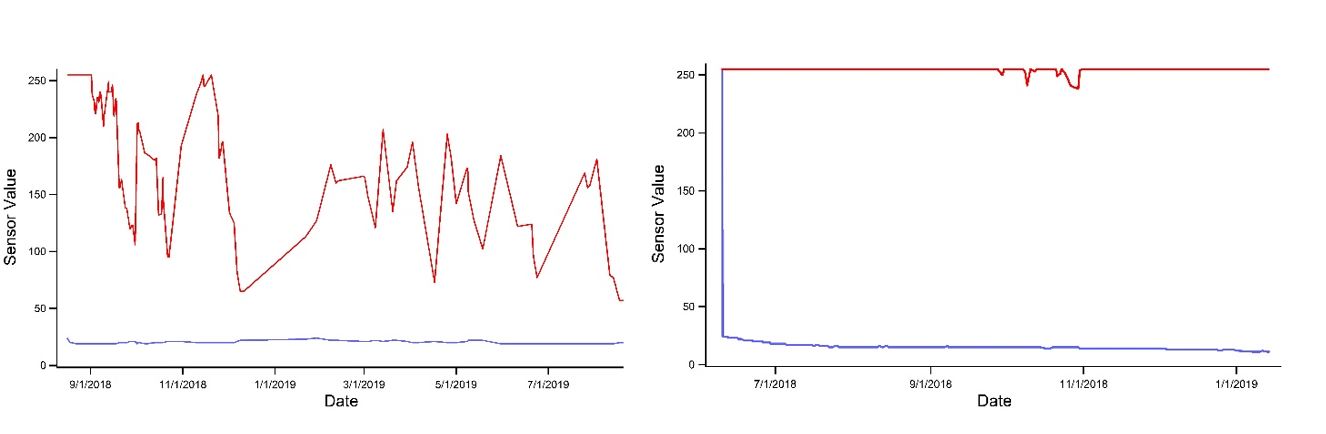
Figure 3. Wet/dry data from a tag that shows increasing biofouling (left) and a tag that was protected with anti-fouling paint (right). Blue indicates the minimum wet-dry value (MinWetDry) for the previous day and red indicates the maximum value (MaxWetDry) for the previous day.
Examples of How to Quickly Plot Wet/Dry Data
Preventing Fouling
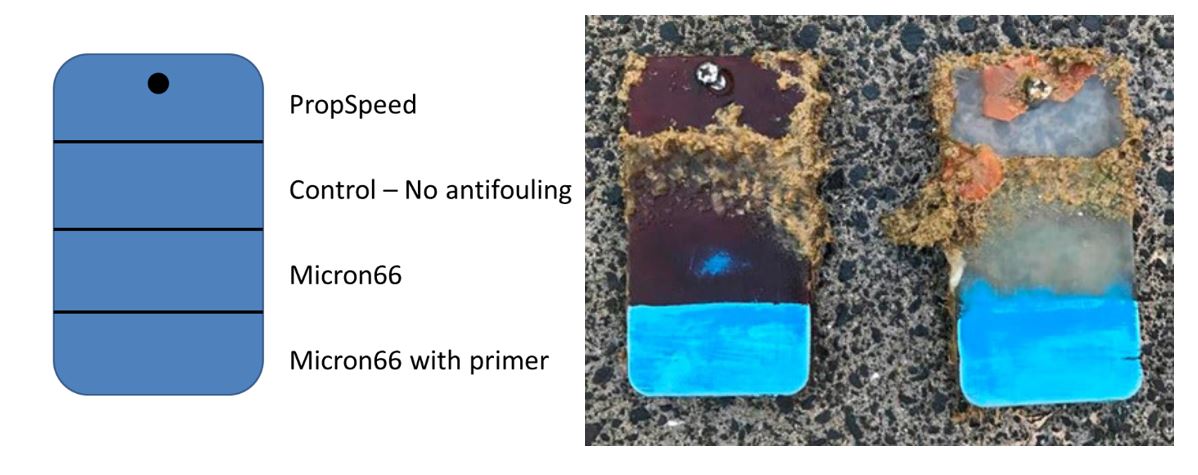
One of the easiest ways to prevent biofouling is to apply antifouling paint to a tag prior to deployment. Our field tests with antifouling paints like PropSpeed and Micron66 show that these greatly inhibit biofouling. Below is an image of submerged polyurethane and epoxy test plates after two months on a wharf pile in New Zealand.
PropSpeed is at the top and has done a reasonable job but has started to fail. Next is a control blank area with no protection that has fouled badly. The next strip down had Micron66 and no primer and the Micron66 has nearly worn away completely. The Micron66 at the bottom has primer and is pristine. One coat of Interprotect primer and three coats of Micron66 are recommended for a successful project.
Learn more about how to properly antifoul your tags here: