25 Jun New Data Product Launches on MiniPAT
Wildlife Computers released a new data product on the MiniPAT called Activity Time Series (ATS). ATS provides a transmittable metric of activity, that can be coupled with other time series data (temperature and/or depth). This new data product is a powerful new tool for studying the activity of free-ranging animals.
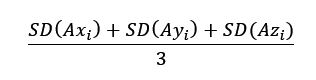
ATS uses a 3-axis accelerometer, sampling at 10 Hz, to calculate the number of “active events” that occur during the user-specified time series interval (75 to 600 sec). Active events are counted if the movement of the tag/animal (mobility) is above the normal range as measured over a much longer summary period (1 to 8 hours). The algorithm calculates the standard deviation of each accelerometer axis (X, Y, Z) over a three-second sliding window over the 10 Hz data. We then calculate ‘mobility’, which is the row-wise (all three axes) mean of the previously calculated standard deviations:
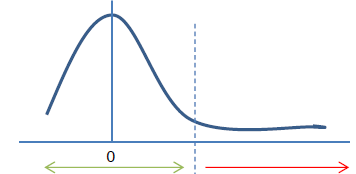
The mobility vector is essentially a filtered proxy for ODBA. Next, we center the mobility vector on O. The shape of this distribution allows us to identify outliers in the tail (see figure below). Active events (outliers) are identified as any mobility value found in the upper tail of the distribution, beyond the threshold (red region in the figure below). We define the threshold for outliers using the absolute value of the minimum centered-mobility value. Any mobility value greater than the threshold is considered an outlier and counted as an active event. The threshold is redefined for each summary period of mobility data, making it adaptable and very sensitive.
As with all other time series data products, there is a summary period associated with each time series interval. For example, the series range for a 75-second interval is determined over a one-hour summary period. To describe these summary periods, which range from 1-8 hours, the mean and standard deviation of the mobility values are stored for transmission. These values can be used to compare the general activity level, between summary periods, over the whole deployment. The following description is an easy visualization of what this new data product can do:
Imagine a Wildlife Computers engineer relaxing on a Saturday. In the morning, the engineer goes for a long run on a muddy, wet trail. The engineer jumps over the mud puddles so his/her shoes stay as dry as possible. After a long run, the engineer relaxes on the sofa, watching a Seattle Sounders match and drinking a beer. ATS will show a generally higher activity level during the run and count the number jumps. ATS will also show a generally lower level of activity and count the number of times the engineer raises the beer to drink. The jumps and the beer drinking are both outliers during each activity and are reported. And the relative level of activity for running and sitting is reported. All this occurs in a self-adjusting algorithm with no need for species-specific settings.
We tested and validated ATS in a captive setting on Cobia and dogfish, and in wild deployments on sandbar sharks in Florida and Maryland. The paper describing these results has been submitted for publication by Rachel Skubel from the Shark Research & Conservation lab at the University of Miami.
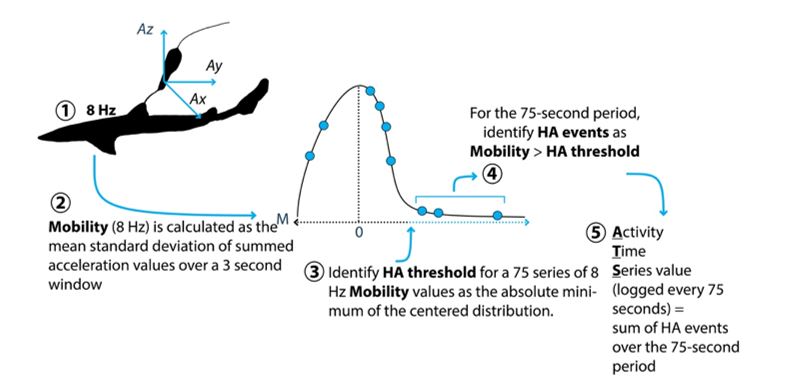
Skubel et al (in review) A novel satellite-transmitted data product for monitoring activity levels of aquatic animals. Note: When Rachel was testing ATS, the accelerometer was sampling at 8 Hz, we have since made adjustments and are now able to sample at 10 Hz without sacrificing battery life.
If you want to use ATS, simply enable Time Series Messages in the Wildlife Computers Data Portal when setting up a new MiniPAT, and select ‘Activity.” Older models of the MiniPAT are not able to run ATS, but you can still turn on the depth and temperature time series data products.