25 Jun Utilizing Argos Pass Analysis
DISCLAIMER: As of 2025, Argos Pass Analysis is only used with the Argos-Classic satellites. The Kineis satellite system has over 20 satellites available making this process obsolete.
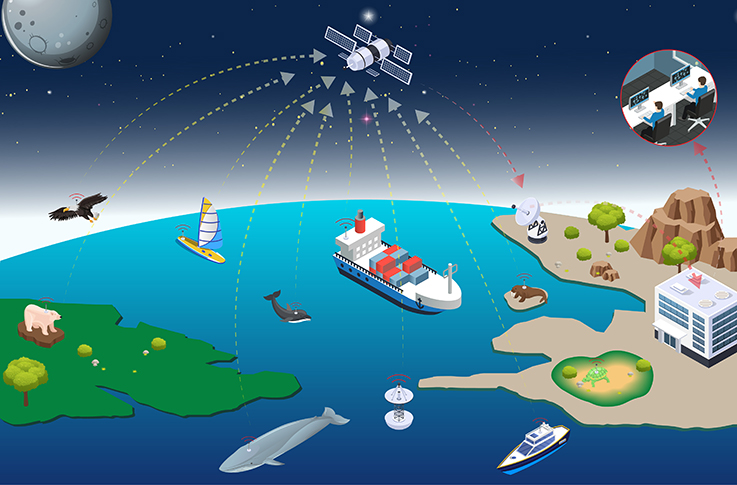
Catching an animal and deploying a tag is just one part of all the work that goes into a successful research project. After the tag is on the animal, then the anxiety sets in as we head back to our offices and wait for the data to come in. There are a number of ways to program your tags that will help increase the likelihood of getting your data, but what it all boils down to is there are only so many satellites in the sky—the ‘pipeline’ to get data from the tag to the satellites is only so big—and the chance that your tag is at the surface the same time the satellite is overhead is slim.
In order to increase the probability of getting your data, Wildlife Computers often suggests transmitting EACH data message at least 5 times. This increases the chances that any particular message makes it all the way into the Wildlife Computers Data Portal and into your hands. It also helps decrease the chance you will have gaps in your data due to message corruption. However, depending on where your tag is in the world, you may need to transmit more or less than 5 times to make sure your messages are received.
In addition to sending one message multiple times, you can also time your transmissions to only occur when a satellite is overhead. Pass prediction like this is helpful if you expect your animal to move less than 500 km from your deployment location, and the utility of this concept diminishes with distance and the number of hours you wish to transmit. However, doing this helps save battery life so your tag is not attempting to connect to a satellite when none are within range. Combining both of these concepts will increase the likelihood of your data being received and therefore decrease the anxiety we all feel when we leave the field with thousands of dollars’ worth of equipment now swimming freely in the ocean.
If you are already programming your tags to take advantage of these concepts, then you will be excited to know that we now have a Shiny App that will tell you which hours the satellites will be overhead and how many transmissions you should use to reach a certain probability of reception. If you are NOT already doing this, then you will be excited to know that we now have a Shiny App that will tell you all the things you need to know so that you can now start programming your tags in this way…if you want to.
What is Shiny? Shiny is an R package that I used to build an interactive web app to visualize the Satellite Pass Prediction data you can get from your Argos account. To use our app, you still need to go into your Argos account first in order to get the data.
Here are the steps you should take in order to use the app:
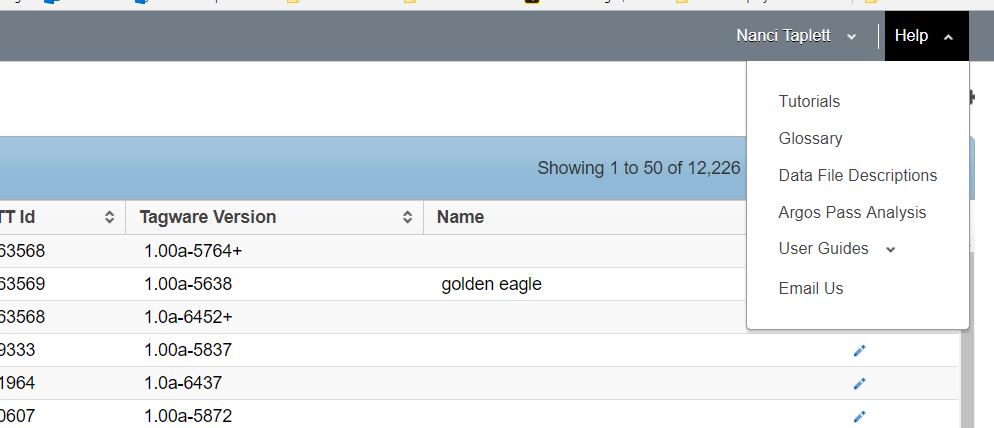
- Go to argos-system.org and log into your account.
- Remember that all Wildlife Computers tags operate using Coordinated Universal Time (UTC). Adjust your Argos settings accordingly.
- In the Dashboard, click on the ‘Satellite pass prediction’ icon

- Specify your simulation period
- Keep all satellites selected
- Choose your location
- Recommended settings: Altitude = 0, Min Elevation = 5, Min Duration = 0
- Click ‘Simulate’
- When you see the ‘Pass predictions list’ click ‘Export’ and choose ‘CSV’.
- Open the Shiny app by clicking this link: https://wcapps.shinyapps.io/argospassprediction/
- Click the ‘Browse’ button to upload the recently downloaded .csv file from Argos.
- Adjust the Separator and Date-Time Specifications according to the settings you have in Argos. (The default for the app is comma-separated and months before days.)
- View some pretty figures of the pass prediction.
- Tab 1: Best transmission hours shows the number of satellite passes per hour of the day.
- Tab 2: Transmission success probability shows the probability of receipt vs number of transmissions
- If you do not see any figures, adjust the ‘Separator’ and ‘Date-Time Specification’ match the data you are trying to upload. Do one thing at a time and allow the app to react before trying a different setting. You can also verify your output by going into the ‘Settings’ in your Argos account to see how you have your dates formatted.
I personally thought the figures that come out of the Pass Prediction on the Argos website were a little tricky to interpret. This app should hopefully clarify the output and will help you find the best transmission hours and rates when programming your own tags. We have been using this app in-house for several months and know you will enjoy it as much as we do! If you have any feature requests or issues with the app, please contact your point person at Wildlife Computers or send an email to dataadmin@wildlifecomputers.com.
Dr. Kenady Wilson is Wildlife Computers resident biologist and data whisperer whose research focuses on quantitative applications for telemetry data. Dr. Wilson is the developer of new analysis methods for telemetry data and author of several research publications including her latest Estimating animal utilization densities using continuous-time Markov chain models. Her publications include work with Stellar sea lions, Harbor seals, and Hawaiian monk seals. She holds her Ph.D. from Duke University. She likes being outside with friends and family and hates it when people put nuts in baked goods.